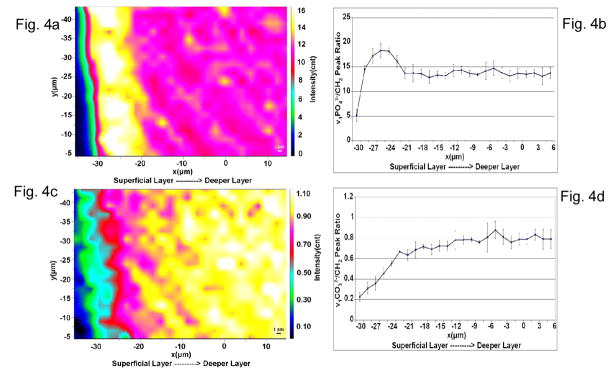
Fig. 4.
Relative mineral/matrix ratios as a function of the distance from the most superficial layer of the specimen. (a) Micro-Raman image showing the v1 of phosphate to CH2 deformation peak area ratios and a ~10μm thick superficial layer with the highest values for the ratio. (b) A profile for v1 of phosphate to CH2 deformation peak area ratio as a function of position. (c) Micro-Raman image showing the v1 of carbonate to CH2 deformation peak area ratios. Lowest values for the ratio are in the superficial layers of the substrate. (d) A profile for v1 of carbonate to CH2 deformation peak area ratios across the imaged area.

