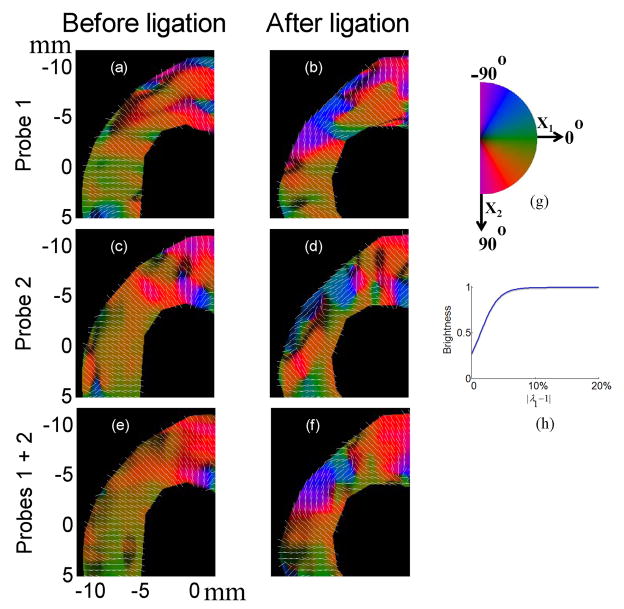
Fig. 6.
The angle of principal axis v1 for strain based on the principal stretch (λ1 −1) in the upper left corner of Fig. 5 at the end of systole before (left column) and after (right column) ligation for different probe combinations when the heart was perfused with K-H perfusion solution. On the left side, the first row presents results using only probe 1 data, the second row presents results using only probe 2 data and the third row presents results combining axial displacement estimates from both probes.. On the right side, (g) presents the cyclic colormap for the angle of principal axis ranging from −90° to 90°; (h) presents the shifted sigmoid function describing the relationship between each color’s brightness and the magnitude of the strain. Vector showing the direction of the principal axis v1 is superimposed.

