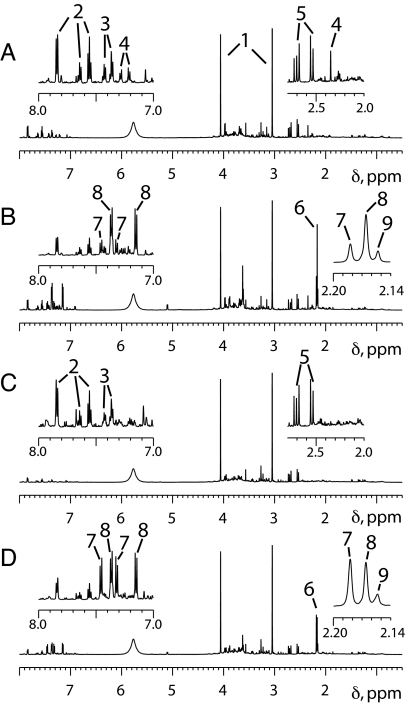
Fig. 1.
Representative 1H NMR spectra of urine samples provided before and after taking 1 g of acetaminophen. (A) The δ 8.0–0.5 region of the predose urine spectrum for a subject whose urine contained a relatively high level of p-cresol sulfate. (B) The corresponding 0–3 h postdose urine spectrum, which shows a relatively low ratio of acetaminophen sulfate to acetaminophen glucuronide. (C) The δ 8.0–0.5 region of the predose urine spectrum for a subject whose urine did not contain a high level of p-cresol sulfate. (D) The corresponding 0–3 h postdose spectrum, which shows a relatively high ratio of acetaminophen sulfate to acetaminophen glucuronide. To facilitate their comparison, all these spectra were processed in the same way, without resolution enhancement and with a digital filter used to minimize the residual water features, which would otherwise be observed at ≈δ 4.7. Furthermore, each spectrum has been scaled so that the creatinine methylene peak at ≈δ 4.06 is just on scale (with the result that the corresponding creatinine methyl peak at ≈δ 3.05 is off scale in each case). The Insets, which are expansions of selected spectral regions, are scaled to fill the available space. Key to numbered peaks: 1, creatinine; 2, hippurate; 3, phenylacetylglutamine; 4, p-cresol sulfate; 5, citrate; 6, cluster of N-acetyl groups from acetaminophen-related compounds; 7, acetaminophen sulfate; 8, acetaminophen glucuronide; 9, other acetaminophen-related compounds.

