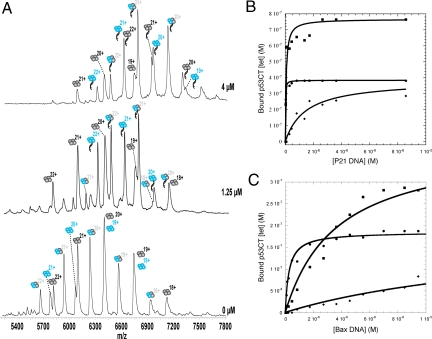
Fig. 4.
Binding of P21 and BAX DNA response elements to preequilibrated wt p53CT (blue) and p53CT R273H (black). (A) MS spectra of wt and mut at different P21 DNA concentrations. (B and C) Fitting of intensities to simple binding isotherms: wt4.DNA (filled circles); wt2mut2.DNA; and (filled squares) mut4.DNA (filled diamonds).

