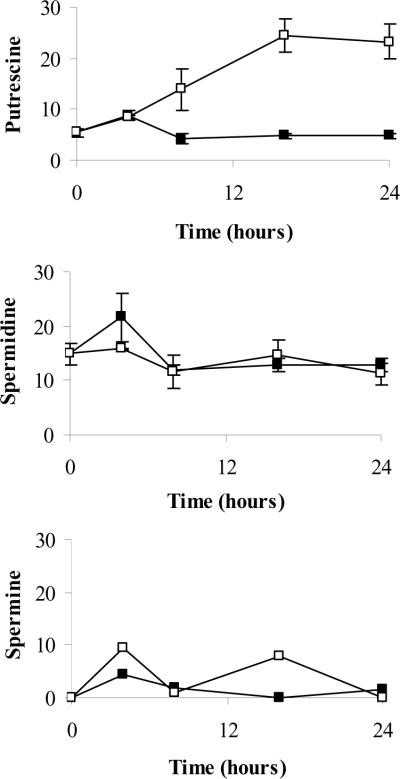
Figure 5.
Intracellular PA pool determination in SAM486A-treated NB cells. SK-N-SH cells were exposed to 10 μM SAM486A or left untreated. Intracellular Put, Spd, and Spm pools were measured at 0, 4, 8, 16, and 24 hours. At 8 hours, SAM486A-treated cells had a significantly larger Put content compared to untreated cells. Put levels continued to rise in later time points. SAM486A did not have any significant effects on Spd and Spm throughout the 24 hour time course. Filled squares (■) and open squares (□) represent data collected from untreated and SAM486A-treated NB cells, respectively. Data are expressed as nmol/mg protein and represent the mean (± SE) of three independent experiments (n=3).

