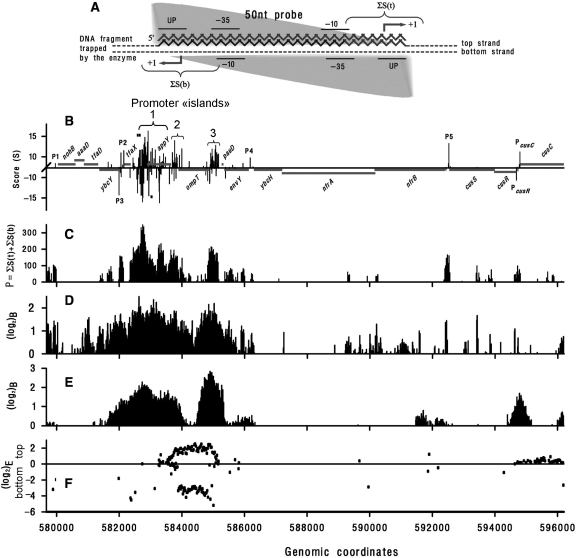
Figure 4.
(A) Scheme illustrating the strategy used to convert PlatProm scores into probability of RNAPol binding (P). Fifty-nucleotide microarray probe is shown as a gray zigzag line. Dashed and composite lines represent two strands of DNA trapped by RNAPol. To take into account both orientations of the enzyme (gray triangle) P was calculated as the sum of S near the expected TSPs on both strands (indicated by braces). The most adequate values of P are expected if a given probe exactly fits to a promoter but allowed (±8 bp) variation in position of the potential start ensures capturing scores of promoters shifted by 1–6 bp as well (microarray probes are distributed along DNA with 12 bp periodicity). Plot (C) shows the result of this converting procedure for PlatProm scores predicted in 57 9670–596 200 bp genomic region (B). Horizontal gray lines indicate gene positioning. The X-axis is placed at ‘level 2’. Known TSPs of PcusR and PcusC are indicated. Three braces in plot (B) confine promoter ‘islands’. Tick marks indicate positions of primers used for PCR. (D) RNAPol-binding efficiency represented as log2 of the ratio of hybridization signal obtained with DNA co-immunoprecipitated with the enzyme by β′-specific antibody to control DNA recovered from complexes without specific immunoprecipitation (12). (E) The same as (D) but σ-specific antibody was used to collect RNAPol–DNA complexes (13). (F) Transcription efficiency from the top and the bottom strands, respectively, represented as log2 of the ratio of fluorescence signals originated from hybridized cDNA to signals obtained from hybridized sonicated genomic DNA (13).

