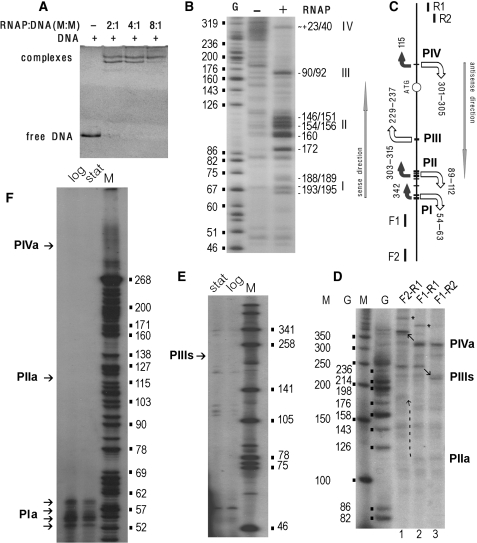
Figure 5.
Experimental verification of promoter activity within PI1 (Figure 4B). All procedures are described in ‘Materials and methods’ section. (A) Gel-shift assays were performed at different RNAPol–DNA ratios as indicated above the gel. (B) Local DNA melting as revealed by potassium permanganate footprinting. The 5′-end of F1 (C) was 32P-labeled. ‘G’-sequencing ladder. Arabic ciphers on the right indicate positions of unpaired thymines respective to the appY ATG codon. Transcription bubbles are denoted by Roman numerals. (C) Positioning of transcription bubbles (I–IV) in the analyzed DNA fragment. Horizontal lines mark unpaired thymines. Bent arrows with size roughly reflecting the value of S show expected directions of transcription. The lengths of the expected RNA products to the end of DNA fragment amplified with F1 and R1 are indicated nearby. Arrows are white if corresponding RNAs were registered either in vitro (D) or in vivo (F, E). Straight arrows show directions of sense and antisense transcription according to appY. (D) Single-round transcription assay. Arrows show transcripts with migration rate altered due to changed length of the templates. End-to-end products are indicated by asterisks (‘a’ and ‘s’ denote antisense and sense directions). (E) and (F) Products of reverse transcription from the total RNA using R1 (E) and F1 (F). Bacterial cells were harvested at logarithmic and stationary phases as indicated. Lanes M and ciphers nearby calibrate gels on D–F plots.

