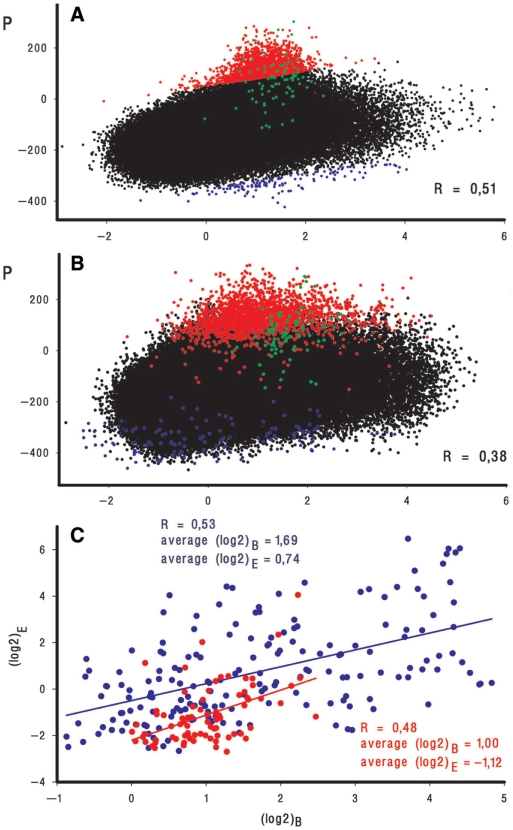
Figure 6.
Correlation between P and efficiency of enzyme binding (log2)B as registered by ChIP-on-chip assays in experiment 2 carried out by Herring et al. (12) (A) and experiment B performed by Reppas et al. (13) (B). Only the ‘+’ strand probes [185 519 and 191 088 for (A) and (B), respectively] are plotted. Outlying points on plot (A) are dissected by invisible lines equally shifted above and below the median and colored. Red and blue symbols on plot (B) represent the same genomic regions in the Reppas et al. (13) data set. Since blue outliers in the second data set tend to fit better to the expected range of log2 ratios, this slight deviation was not considered as regular and was not further analyzed. Points representing promoter ‘islands’ 1–3 (Figure 4B) are shown in green. The indicated values of R were quantified for the whole set of microarray probes using (log2)B and P averaged within running window 3. (C) Correlation between RNAPol binding (log2)B and expression (log2)E efficiencies plotted for 78 PIs (red symbols) and 181 single promoters (blue symbols). For PIs (log2)B were quantified as average values of ChIP-on-chip signals for all probes covering corresponding genomic areas (Supplementary Table 2). (Log2)E was first quantified as an average log2 ratio of chip signals obtained upon cDNA hybridization with 10 probes representing the 250-bp region downstream from the last predicted TSP on each strand. Two values characterizing transcription in both directions were then compared and the largest one was considered as the measure of expression efficiency. Other variants of (log2)E calculation see in Supplementary Table 2. (Log2)B and (log2)E for ‘normal’ promoters were quantified within 250 bp region upstream and downstream from the position +1, respectively (Supplementary Table 3). Both (log2)B and (log2)E were averaged for two replicates of Reppas et al. (13) data set. First-order regression lines show apparent dependence between (log2)B and (log2)E for both promoter ‘islands’ and ‘normal’ promoters.

