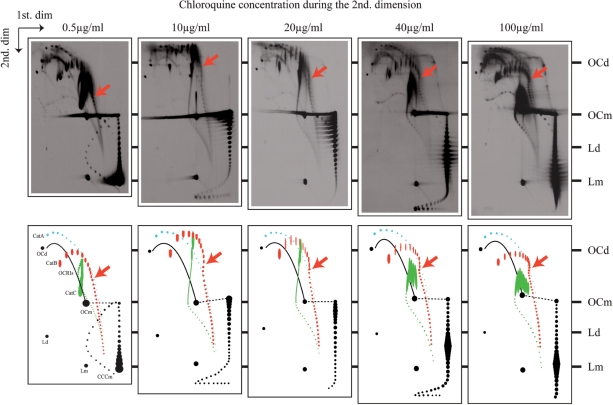
Figure 4.
In CatBs and CatCs interlinking and supercoiling compete with each other. Autoradiograms of 2D gels corresponding to pBR18 isolated from DH5αF′ E. coli cells after exposure to norfloxacin to accumulate catenated forms. The second dimension occurred in the presence of different concentrations of chloroquine and the autoradiograms were aligned so that OCs and Ls, whose electrophoretic mobility is not significantly affected by chloroquine, coincided. A diagrammatic interpretation of each autoradiogram is shown below where CatAs are depicted in blue, CatBs in red and CatCs in green. In the diagrams corresponding to 10 and 40 µg/ml chloroquine, CatCs where Ca = 3–12 were drawn as a continuous line as individual spots were difficult to identify at the resolution of these photographs. Monomeric topoisomers are depicted in black. OCRIs = nicked replication intermediates; OCd = open circles corresponding to dimers; OCm = open circles corresponding to monomers; Ld = linearized dimers; Lm = linearized monomers. Red arrows point to CatBs with the lowest Ca value (10–12) that chloroquine was unable to decompose in topoisomers during the second dimension.

