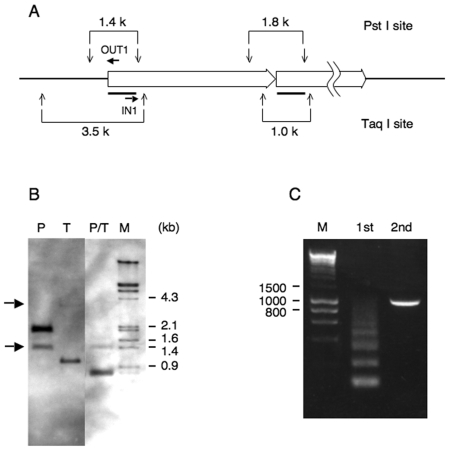
Figure 2. IPCR after PstI restriction enzyme digestion.
(A) Restriction enzyme map of PstI and TaqI. PstI and TaqI sites are located approximately 0.7 kb and 2.5 kb up-stream of the transgene, respectively. The bold lines indicate location of the 0.7 kb probe. Primers (OUT1 and IN1) were used for the 2nd IPCR. (B) Southern blot analysis. In addition to the expected size, an additional band (indicated by arrows) was detected by PstI (1.4 kb) and TaqI (3.5 kb) digestion. (C) PstI digested DNA fragment (1.4 kb) was eluted from the gel, purified and IPCR was carried out. The expected size (1 kb) of the 2nd PCR product was obtained.

