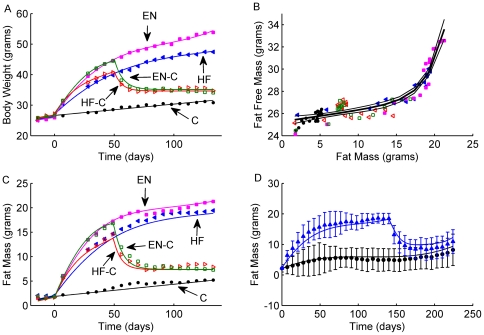
Figure 1. C57BL/6 mouse data and model predictions for fat mass.
Panel A: measured body weight in male C57BL/6 mice from 5 diet groups: the C group on chow diet (closed black circles), the HF group on high fat diet (closed blue triangles), the EN group on high fat diet plus Ensure (closed pink squares), the HF-C group on high fat diet for 7 wk followed by a switch to chow (open red triangles), and the EN-C group on high fat diet plus Ensure for 7 wk followed by a switch to chow (open green squares). The solid lines labeled are fitted curves to body weight data. Panel B: Measured body fat mass (F) and adjusted fat free mass (FFM) from the 5 groups designated using the same markers as in Panel A. These data were fit to a single exponential function for all groups:  (thick line with thin lines representing 95% confidence intervals). Panel C: measured fat mass from the 5 groups where the data point markers was the same as in Panel A. The solid lines are model predictions for fat mass. Panel D: measured fat mass from a separate experiment with two groups of male C57BL/6 mice: group one on chow diet for 33 wk (closed black circles); group two on high fat diet for 20 wk followed by a switch to chow (closed blue triangles). The error bars represent 95% confidence interval for the measurements. The curves represent the model predictions for fat mass in groups one (black) and two (blue).

