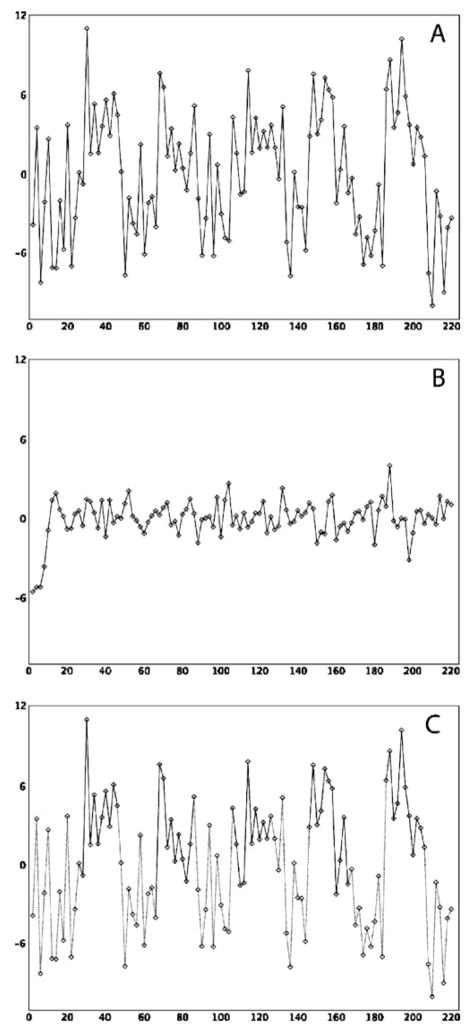
Fig. 2.
Sample time series simulated at a TR of 2 s for Region 1 of the causal structure for data modeled to include task related variance (a), intrinsic variance from steady-state performance of the task (b), and intrinsic variance from a trimmed time series (c). For the case of the trimmed time series (c), the sections of the time series corresponding to task performance are highlighted by the solid black line and were concatenated into a single, continuous vector

