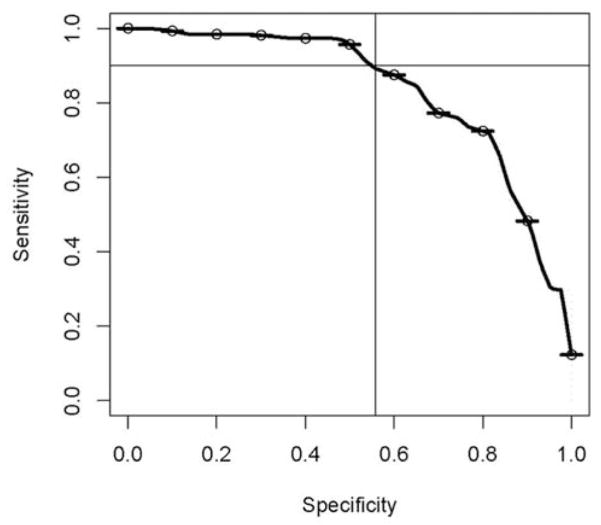
Figure 2.
The Response Operating Curve Using First Grade d′ Scores From the Number Sets Test to Diagnosis MLD in Third Grade
Note: Sensitivity of d′ for the correct classification of MLD is represented on the y-axis and specificity (incorrectly classifying a child as not having MLD) on the x-axis. The tradeoff between sensitivity and specificity is illustrated for a sensitivity of 0.9. Using d′ scores to correctly identify 90% of children with MLD will result in 56% of children without MLD being correctly identified as such. MLD = mathematical learning disability.

