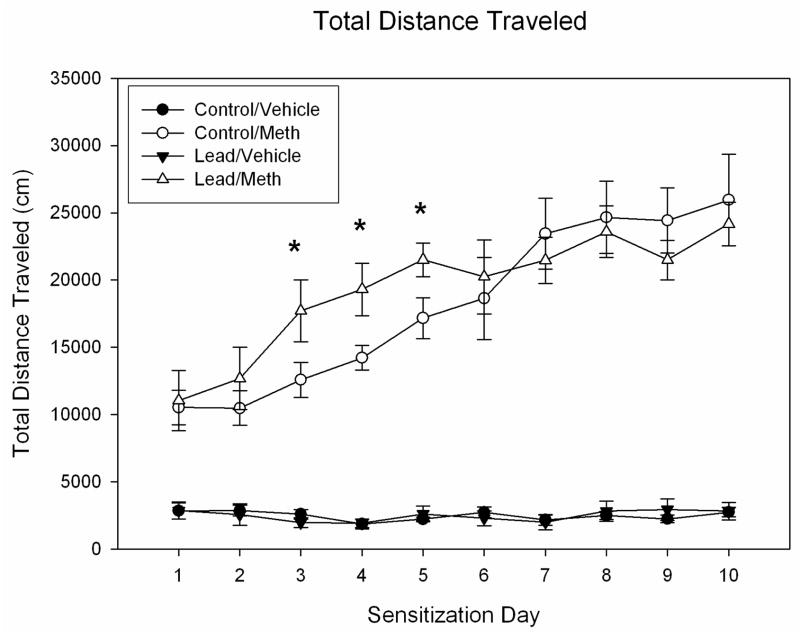
Figure 1.
Mean group changes in total distance traveled scores (cm) over a 45 min period for control and lead-pretreated rats injected daily with either vehicle (VEH) or 1.0 mg/kg METH (n=8 per group) on Days 1–10. The bar above each symbol reflects the standard error of the mean for that value. Significant differences (p < 0.05) between control and lead-pretreated groups are denoted by a *.

