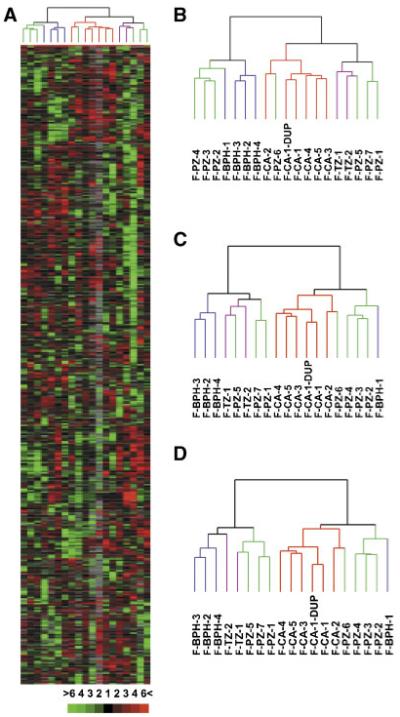
Fig. 1.

Hierarchical clustering analysis of genes differentially expressed in prostatic stromal cells. A: Overview of relative expression levels of 714 genes represented by 1,032 clones whose expression varied at least threefold from the mean abundance in at least three samples in all 18 stromal cell cultures. Each column represents data from a single stromal cell culture, and each row represents expression levels for a single gene across the 18 samples. Transcripts upregulated were in red and downregulated in green. The degree of color saturation corresponds with the ratio of gene expression shown at the bottom of the image. Full transcript identities and raw data are available at http://www.Stanford.edu/∼hongjuan/stromal. In the dendrogram shown on top of the image, BPH cells were colored in blue, CA cells in red, PZ cells in green, and TZ cells in purple. The same color code was used in (B-D). B: Dendrogram of clustering analysis using the 1,032 clones described in (A). C: Dendrogram of clustering analysis using 455 clones representing 361 genes whose expression varied at least threefold from the mean abundance in at least four samples in all 18 stromal cell cultures. D: Dendrogram of clustering analysis using 232 clones representing 192 genes whose expression varied at least fourfold from the mean abundance in at least four samples in all 18 stromal cell cultures. [Color figure can be viewed in the online issue, which is available at www.interscience.wiley.com.]
