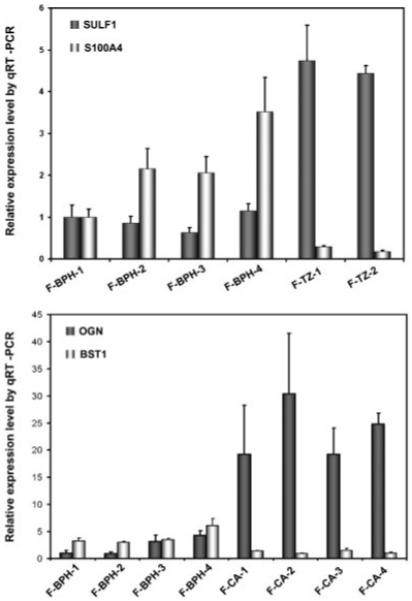
Fig. 2.

Validation of gene expression changes observed using microarray by real-time RT-PCR. Levels of transcripts of interest determined by PT-PCR in triplicates were normalized against that of TBP in the same sample. For comparison, expression levels in F-BPH-1 were scaled to 1, except for BST1, for which expression level in F-CA-4 was scaled to 1.
