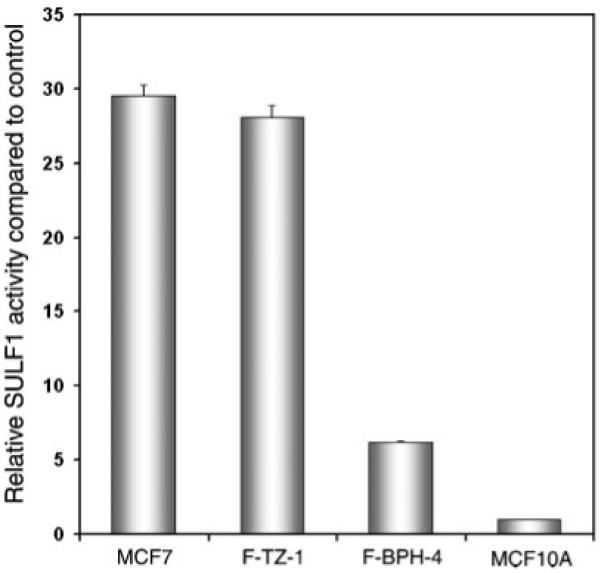
Fig. 5.

Sulfatase assay in cultured BPH and TZ stromal cells. Relative activity was calculated by scaling the activity in MCF-10A cells, the negative control, to 1. MCF-7 cells were used as a positive control. F-BPH-4 cells showed a more than fourfold decrease in SULF1 activity compared to F-TZ-1 cells.
