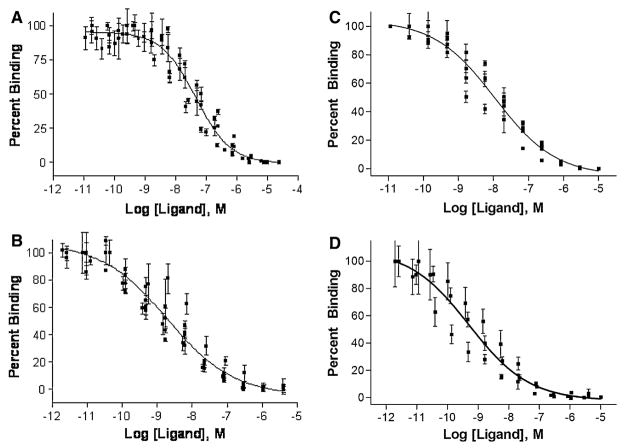
Fig. 4.
Representative curves from the competitive binding assay of heterobivalent ligands evaluated for their monovalent and bivalent binding by competing them against Eu-labeled NDP-α-MSH and CCK-8 ligands. Single plot IC50 values were determined where data from all n measurements were pooled first and non-linear regression analysis performed. (a) Binding of Ligand 2 competed with 0.1 nM Eu-CCK8 in Hek293/CCK cells, with an IC50 of 46 nM (R2 = 0.90). (b) Binding of Ligand 2 competed with 0.1 nM Eu-CCK8 in Hek293/MC4R/CCK cells, with an IC50 of 2.3 nM (R2 = 0.89). (c) Binding of Ligand 6 competed with 0.1 nM Eu-CCK8 in Hek293/CCK cells, with an IC50 of 11 nM (R2 = 0.93). (d) Binding of Ligand 6 competed with 0.1 nM Eu-CCK8 in Hek293/MC4R/CCK cells, with an IC50 of 0.5 nM (R2 = 0.83)

