Figure 2.

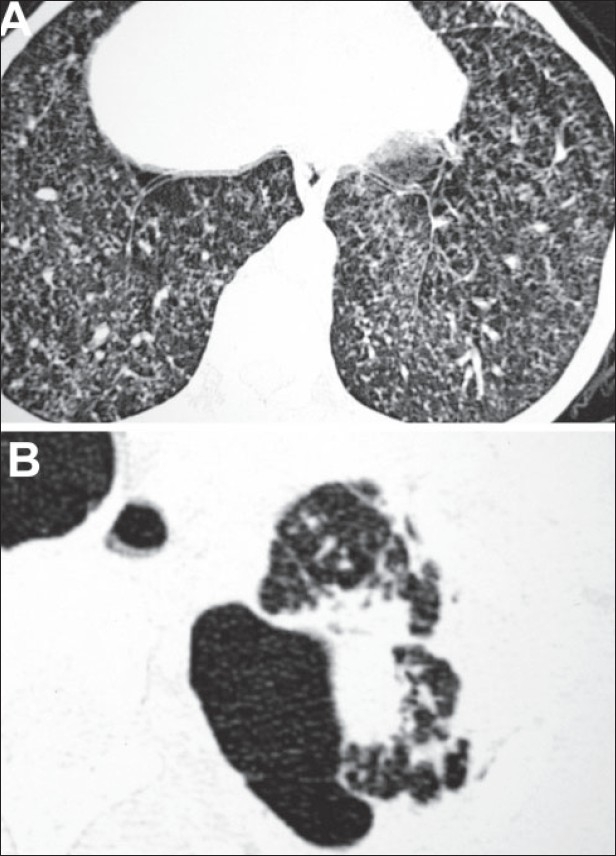
A. Computed tomogram revealing miliary opacities over bilateral lung fields. B. Computed tomogram showing multiple blebs over the left apex.

A. Computed tomogram revealing miliary opacities over bilateral lung fields. B. Computed tomogram showing multiple blebs over the left apex.