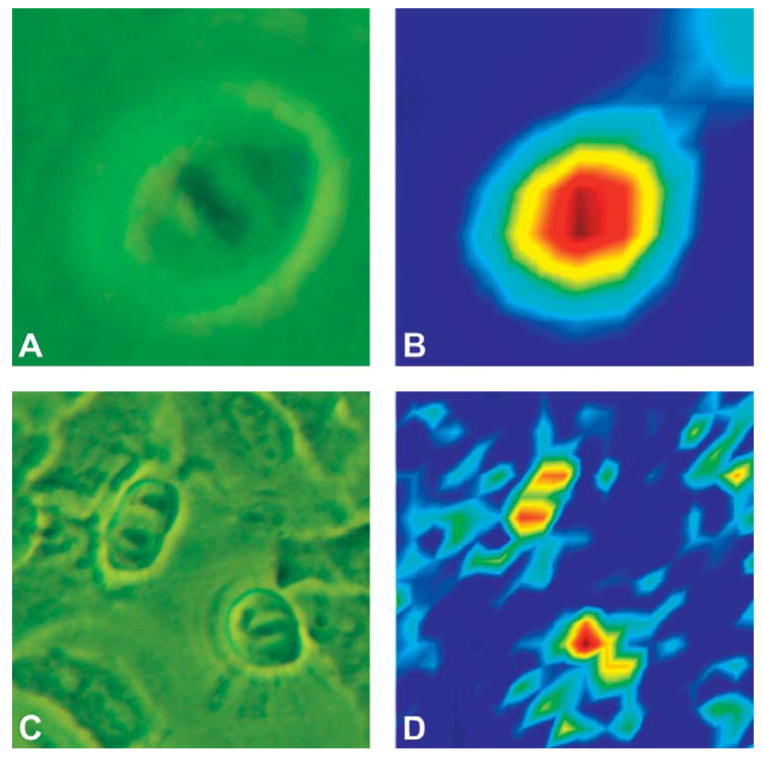
Fig. 5.
Phase-contrast images of HeLa cells in (A) metaphase and (C) anaphase. (B) Infrared spectral map based on the amide I absorption intensities, of the cell shown in (A). In the center of the nucleus, the largest intensity correlates with the position of the chromatin. Dark blue indicates low intensity, and yellow to red indicate higher and highest intensity, respectively. (D) Resolution-enhanced infrared spectral map based on the 2925 cm−1 absorption region of the cell shown in (C). The two chromatin regions of the cell in anaphase are detectable. The color scheme is as in (B).

