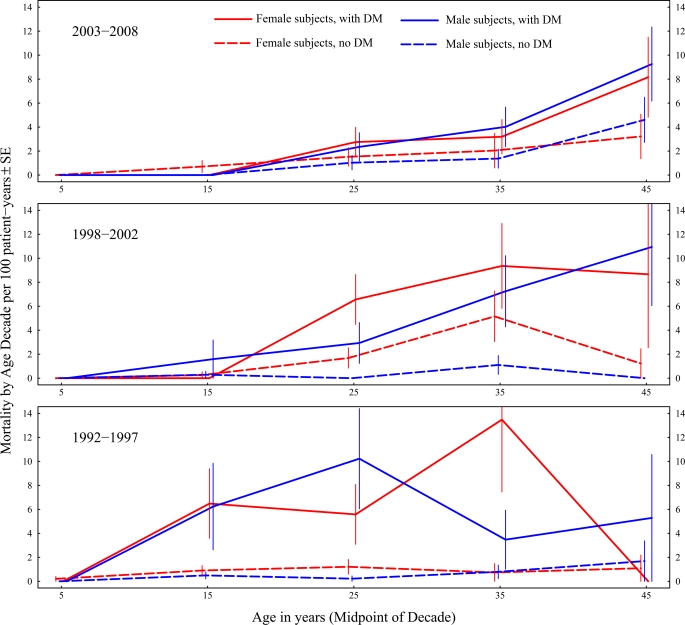
Figure 3.
The University of Minnesota CFRD and CF mortality per 100 patient-years by sex and age decade over three time periods: 2003–2008, 1998–2002, and 1992–1997. CF patients with diabetes (DM) are shown with solid lines, while CF patients without diabetes are shown with dashed lines. Zero rates estimated from <10 patients are not shown. The gap in mortality between those with and those without diabetes has diminished over these time periods, and the sex difference in mortality has disappeared in the most current analysis.

