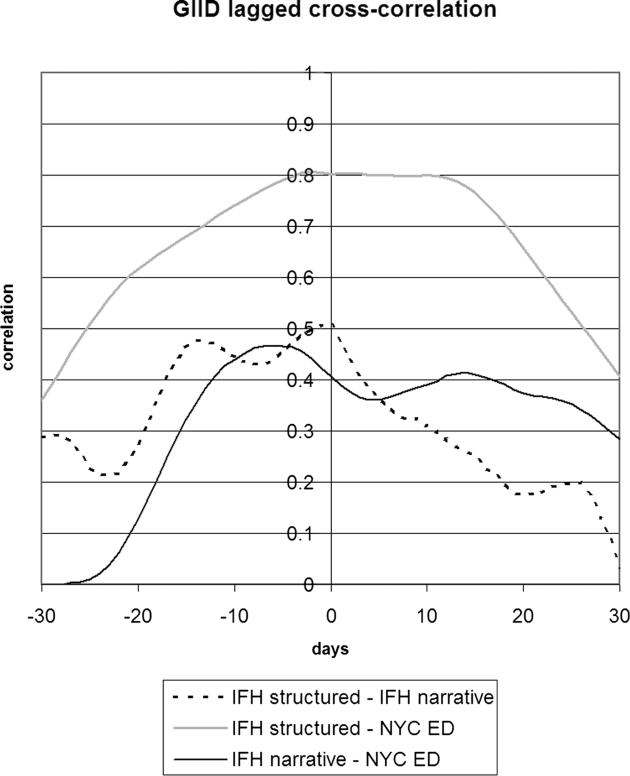
Figure 7.
Lagged cross-correlation among the proportions of cases positive for gastrointestinal infectious disease for IFH structured data, IFH narrative data, and NYC DOHMH emergency department chief complaint data. A peak to the left of 0 days implies that the left entity in the figure legend preceded the entity on the right. IFH = Institute for Family Health; NYC = New York City; DOHMH = Department of Health and Mental Hygiene.

