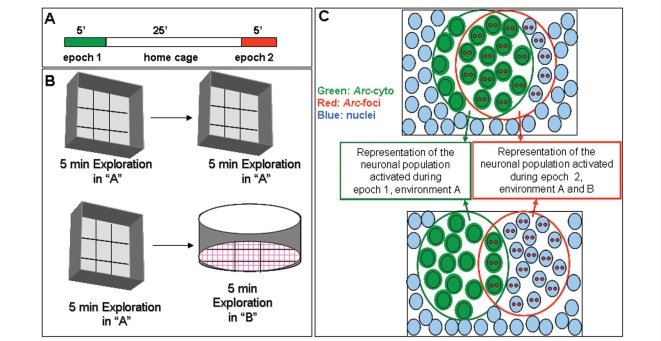
Figure 1.
Schematic representation of the experimental procedure (A) and types of novel environments (B) used in this study. Animals were allowed to explore the novel environment A for 5 min (epoch 1). After 25-min rest period in the home cage, the rats were exposed to either environment A again or environment B (epoch 2). Environment A was an open box (61 × 61cm) with 24-cm high walls. Environment B was a cylinder (75-cm diameter), and was located in a different room than environment A. (C) Schematic representation of the neuronal populations that express Arc (cytoplasmic, intranuclear foci or both) following exploration of identical (AA, top illustration) or different (AB, bottom illustration) environments. Nuclei are indicated by light blue circles, Arc transcription foci (Arc-foci) are indicated by two reds spots in the nuclei, cytoplasmic Arc mRNA (Arc-cyto) is indicated by green coloured nuclei and green shading. The green open circle contains the neuronal population activated during epoch 1 and the red open circle contains the neuronal population activated during epoch 2. The overlap between these two circles represents the neuronal population activated during both epoch 1 and epoch 2. In rats exposed to the same environment twice (AA, top illustration) the majority of Arc positive cells contain Arc-cyto and Arc-foci; indicating that Arc activation occurs in the same cell population of neurons during each exposure. Rats exposed to two different environments (AB, bottom illustration) show an equal proportion of stained for Arc-cyto or Arc-foci and smaller proportion containing both; suggesting that different environments activate independent populations of neurons.

