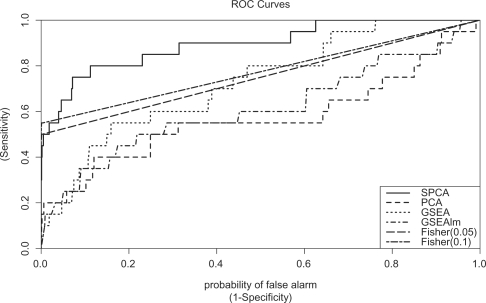
Fig. 1.
Comparison of performances of SPCA, PCA, GSEA and Fisher's exact test using simulated data. This figure shows the ROC for the methods SPCA, PCA, GSEA and Fisher's exact test for scene 4 in Table 1. Fisher (0.05)=Fisher's exact test, using FDR 0.05 as significance cutoff for differential expression of single genes. Fisher (0.1)=Fisher's exact, using FDR 0.1 as significance cutoff for differential expression of single genes. There were 20 simulated datasets, each dataset has 2500 genes assigned to 50 gene sets, among them only the first gene set include genes associated with outcome by design. See text for details of simulation experiment.

