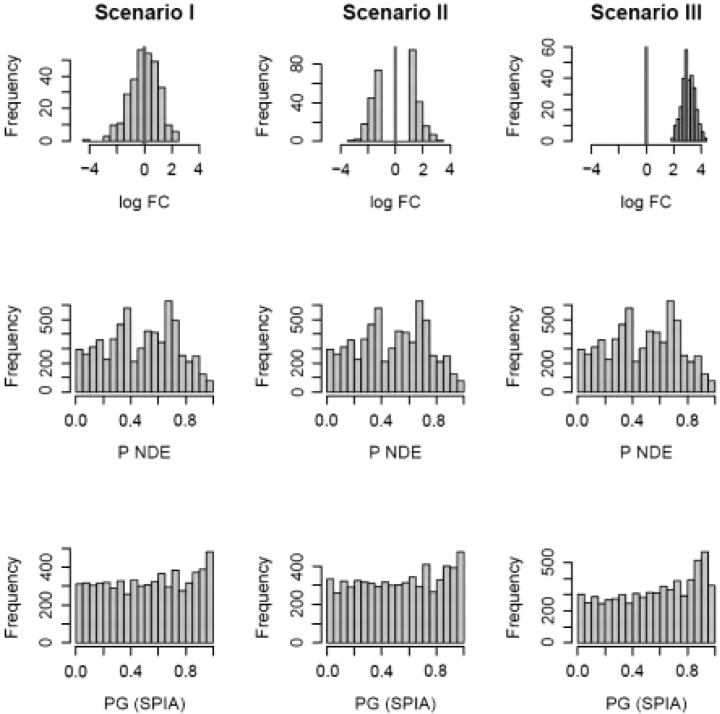
Fig. 2.
Distribution of P-values under three null distribution scenarios for the hypergeometric and SPIA models. Nde=300 gene IDs were selected at random out of 20 000 possible IDs containing all genes on all 52 pathways analyzed. The randomly selected gene IDs were assigned log fold-changes from (i) a random normal distribution N(0,1); (ii) a bimodal distribution obtained by sampling from the tails of a N(0,1) distribution; and (iii) random normal N(3,0.5). For each scenario, the experiment was repeated 200 times and PNDE, PPERT and PG were computed for all pathways receiving at least one DE gene. The resulting P-values for all pathways and all iterations were pooled together and shown as histograms for ORA (PNDE) and SPIA (PG) on rows 2 and 3, respectively. The false positives rates for SPIA at α = 5% were 4.7%, 5.0% and 4.6%, in scenarios I, II and III, respectively. For ORA, the same positive rates were 4.5% in all three scenarios. False positive rates as an average over these three scenarios are provided in Table 1 for several values of Nde.

