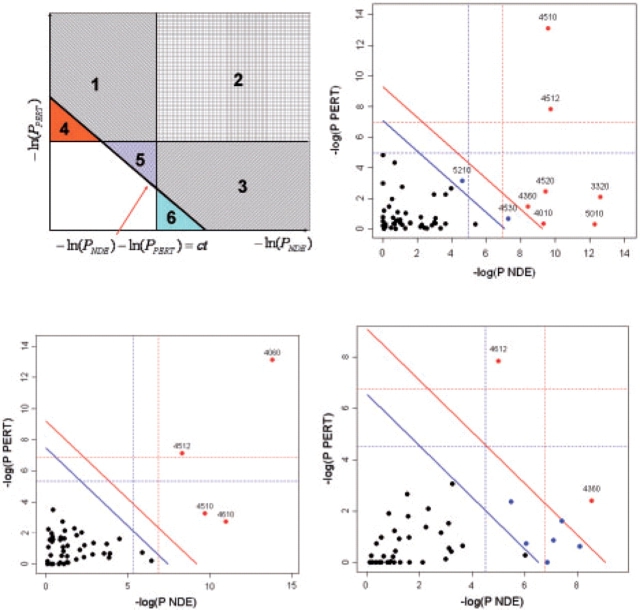
Fig. 4.
Two-dimensional plots illustrating the relationship between the two types of evidence considered by SPIA. The X-axis shows the over-representation evidence, while the Y-axis shows the perturbation evidence. In the top-left plot, areas 2, 3 and 6 together will include pathways that meet the over-representation criterion (PNDE<α). Areas 1, 2 and 4 together will include pathways that meet the perturbation criterion (PPERT<α). Areas 1, 2, 3 and 5 will include the pathways that meet the combined SPIA criteria (PG<α). Note how SPIA results are different from a mere logical operation between the two criteria (OR would be areas 1, 2, 3, 4 and 6; AND would be area 2). Interestingly, SPIA removes those pathways that are supported by evidence of any one single type that is just above their corresponding thresholds but not supported by the other type of evidence (areas 4 and 6), but adds pathways that are just under the individual significance thresholds but supported by both types of evidence (area 5). The other plots show the pathway analysis results on the Colorectal cancer (top right), LaborC (bottom left) and Vessels (bottom right) datasets. Each pathway is represented by a point. Pathways above the oblique red line are significant at 5% after Bonferroni correction, while those above the oblique blue line are significant at 5% after FDR correction. The vertical and horizontal thresholds represent the same corrections for the two types of evidence considered individually. Note that for the Colorectal cancer dataset (top right), the colorectal cancer pathway (ID=5210) is only significant according to the combined evidence but not so according to any individual evidence PNDE or PPERT.

