
Fig. 1.
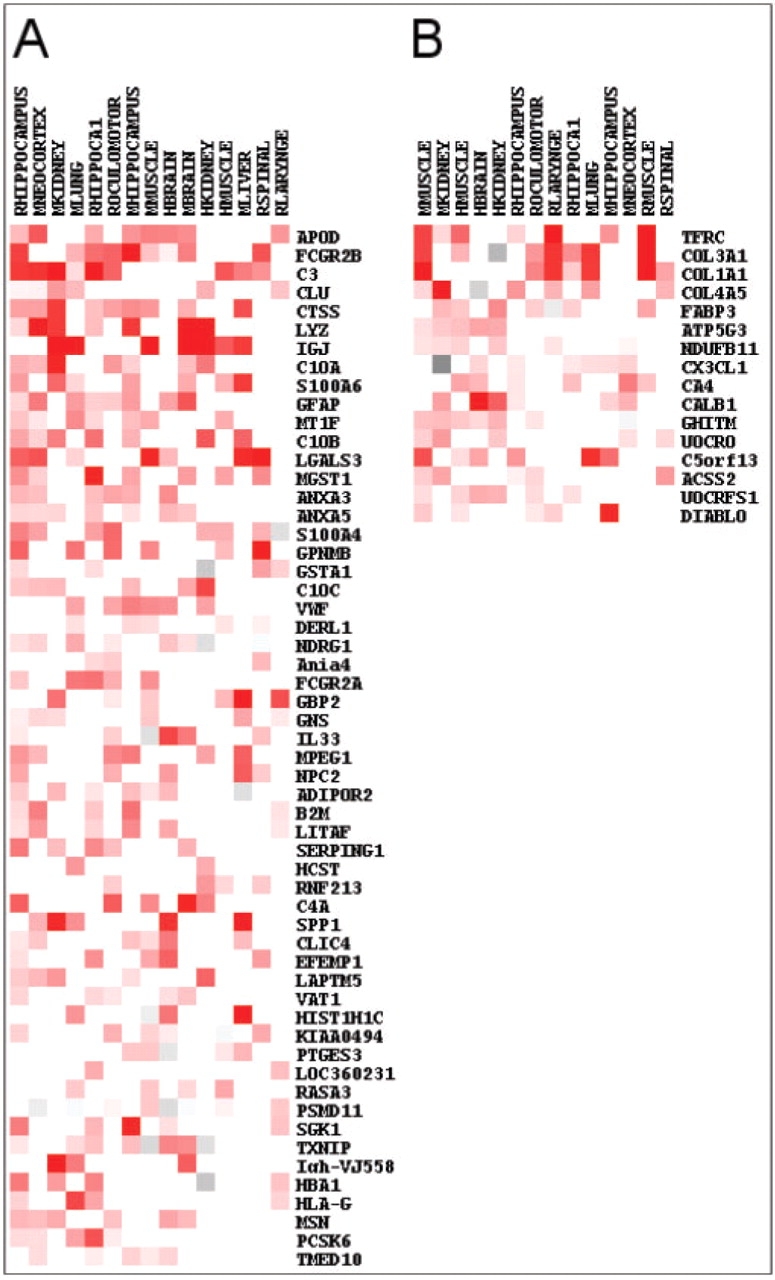
Meta-signature of top genes consistently differentially expressed with age. (A) Genes consistently overexpressed with age. Fifteen datasets were selected for the figure. Red indicates genes overexpressed with age with the intensity proportional to the expression signal old/young adjusted for a common age (see Section 2). Black to gray indicates genes underexpressed with age. (B) Fourteen datasets were selected for the figure. Red indicates genes underexpressed with age with the intensity proportional to the expression signal young/old adjusted for a common age (see Section 2). Black to gray indicates genes overexpressed with age. For both A and B, white indicates either not studied or non-significant and genes are ordered from most to least significant.