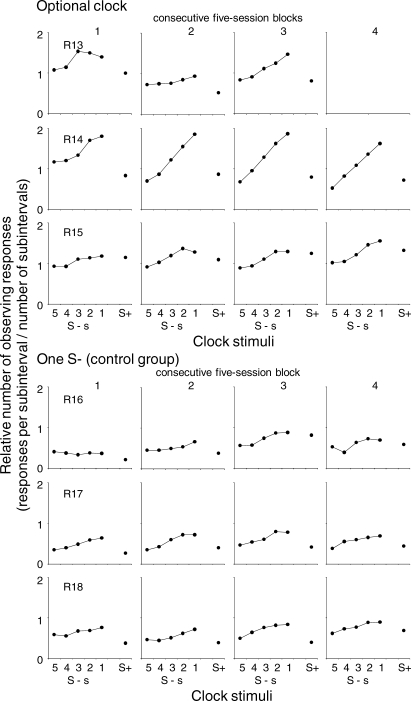
Fig 4.
Mean relative number of observing responses during successive subintervals of the EXT component and during the reinforcement component across the five successive blocks of five sessions. The upper panels show the data for the subjects that were exposed to the optional clock procedure and the lower panels show the data for the subjects in the control group.

