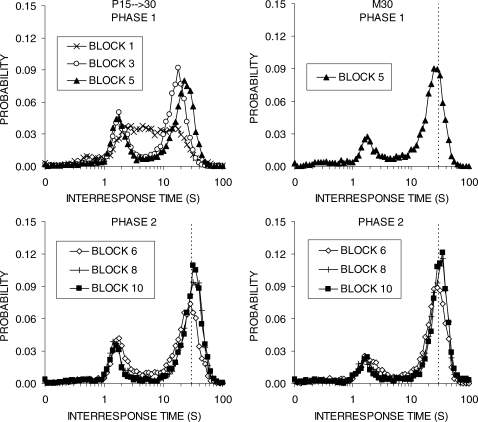
Fig 6.
Interresponse time (IRT) distributions obtained during the first, third, and final block of training in each phase. The different panels display functions for the groups P15 → 30 (left column) and M30 (right column) during Phase 1 (top row) and Phase 2 (bottom row) of training in Experiment 2a. Vertical lines denote the DRL criterion, except in Phase 1 for group P15 → 30 when these rats were exposed to the progressive DRL schedule. The first and third blocks of data are missing from group M30 in Phase 1 due to a computer error.

