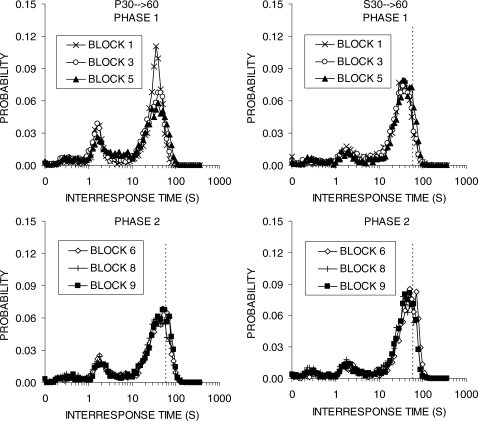
Fig 10.
Interresponse time (IRT) distributions obtained during the first, third, and final block of training in each phase. The different panels display functions for the groups P30 → 60 (left column) and S30 → 60 (right column) during Phase 1 (top row) and Phase 2 (bottom row) of training in Experiment 2b. The vertical bars denote the DRL criterion, except in Phase 1 for group P30 → 60 when these rats were exposed to the progressive DRL schedule.

