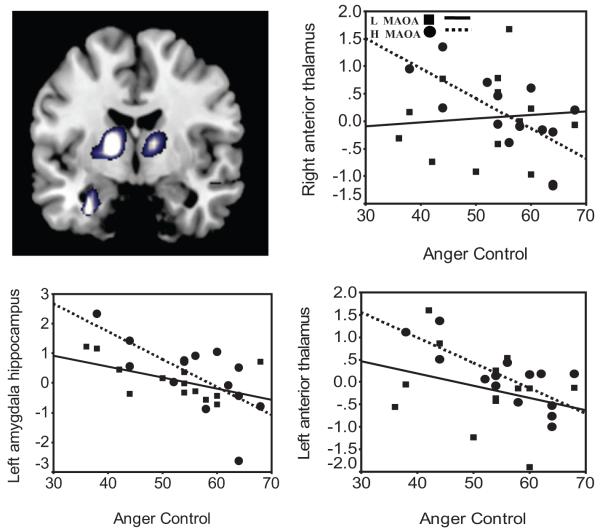
Figure 4.
Gene-brain-behavior model in anger control. Top left panel: Image of the voxel clusters in negative correlation with self-reported anger control and blood-oxygen-level-dependent (BOLD) response to No in bilateral thalamus and left amygdala-hippocampal formation (AHF). The corresponding scatterplots represent of percent BOLD signal change in left AHF (low MAOA, R2 = 0.30, p = .053; vs. high MAOA, R2 = 0.48, p = .009), left anterior thalamus (low MAOA, R2 = 0.09, p = .326; vs. high MAOA, R2 = 0.58, p = .001), and right anterior thalamus (low MAOA, R2 = 0.00, p = .782; vs. high MAOA, R2 = 0.46, p = .008). This figure was derived from the No-Up contrast and validated through comparison of brain responses, derived from regions of interest, to No fixation and Up fixation (see Table S5 in the Supplementary Online Results). Squares and solid regression line indicate low (L) MAOA; circles and dotted line indicate high (H) MAOA.

