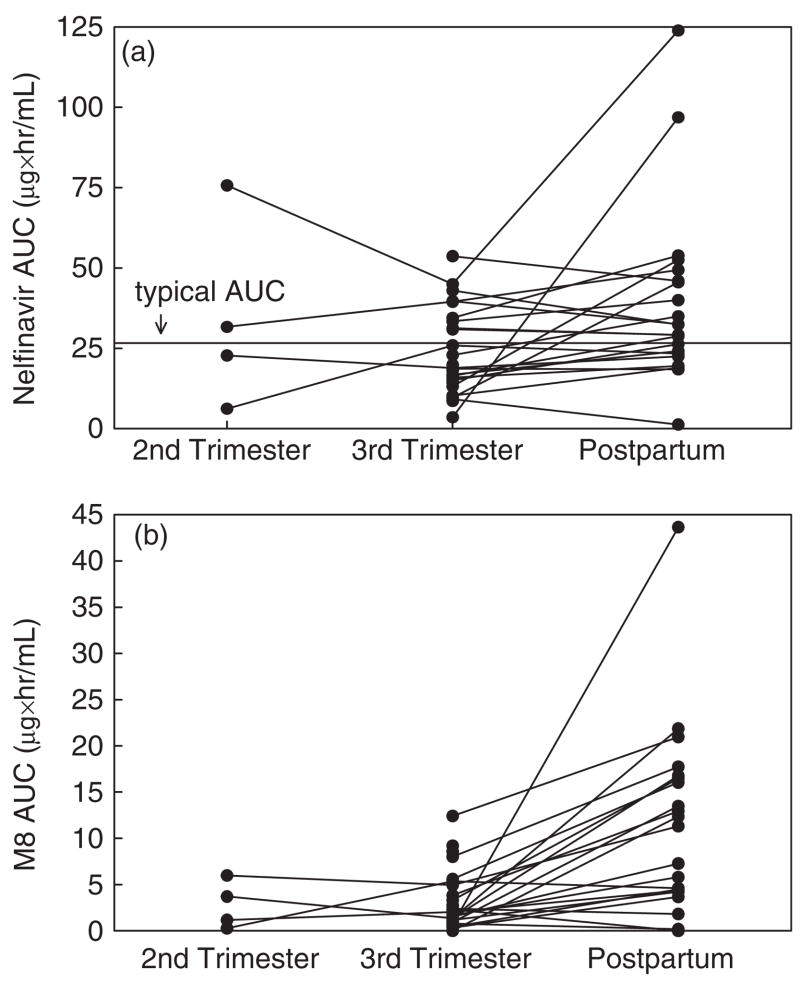
Fig. 2.
Nelfinavir and hydroxyl-tert-butylamide (M8) area under the plasma concentration–time curves (AUCs). (a) Antepartum and postpartum nelfinavir AUCs, second trimester (n = 4), to third trimester (n = 27) to postpartum (n = 22) in the same patients. The horizontal line indicates the 50th percentile AUC in non-pregnant adults (26 μg h/mL). (b) Antepartum and postpartum M8 AUCs, second trimester (n = 4), to third trimester (n = 27) to postpartum (n = 22) in the same patients.

