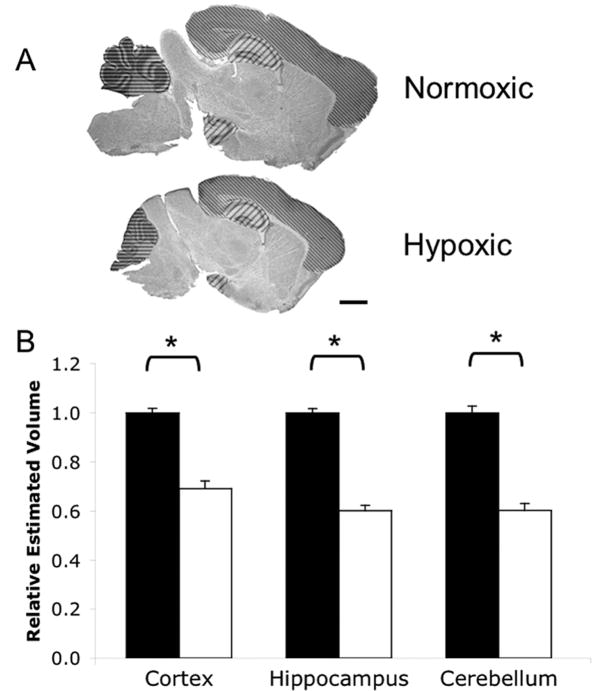
Figure 1. Chronic neonatal hypoxia reduces regional brain volumes.
A) Cresyl Violet staining of normoxic and hypoxic brains of C57BL/6 mice at P11 showing hypoxia-associated size reduction, similar to rat (10). Regions measured are marked. Thin diagonal lines=cortex; thick diagonal lines=hippocampus; horizontal lines=cerebellum. Scale bar=1.0 mm. B) Quantification of cortex, hippocampus, and cerebellum volumes. Black bars=normoxia; white bars=hypoxia. Total N=53 brains, N≥16 per treatment; groups balanced for sex. * p<0.05 vs Normoxic. Error bars=SEM.

