
Figure 4. Chronic neonatal hypoxia produces male forebrain hypo-myelination.
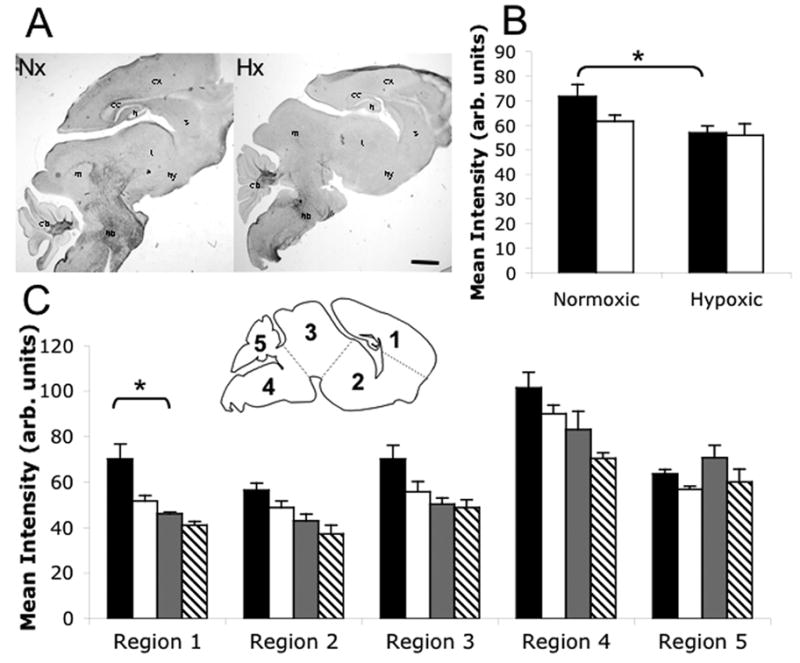
Myelin staining in normoxic and hypoxic brains as visualized with Black Gold II. A) BGII staining; cx=cortex, cc=corpus callosum, h=hippocampus, s=striatum, t=thalamus, hy=hypothalamus, m=midbrain, hb=hindbrain, cb=cerebellum. B) Quantification of myelin staining intensity in whole brains. Black bars=males; white bars=females. C) Quantification of myelin staining intensity in five labeled regions (inset image). Black bars=normoxic males; white bars=normoxic females; gray bars=hypoxic males; hatched bars=hypoxic females. Total N= 13 brains, N≥3 per group. *p<0.05. Scale bar=1mm. Error bars=SEM.