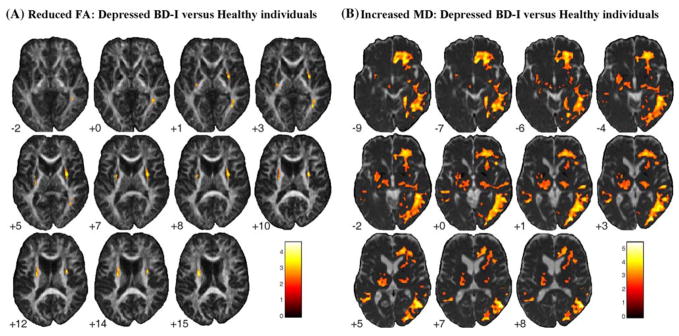
Fig. 1.
Areas of significantly reduced FA (a) and increased MD (b) in depressed BD-I patients relative to healthy controls, with age as covariate. Results at the Z > 2.33 threshold were overlaid on axial brain slices of, respectively, FA and MD maps spatially normalized into an approximation to the Tailarach and Tornoux stereotactic atlas [37]. Foci of decreased FA in bilateral external capsule and right parieto-occipital WM regions, and extensive regions of increased MD involving right ventromedial prefronto-limbic WM, and right temporo-occipital WM were observed in depressed BD-I individuals, as well as more restricted regions of increased MD in the left uncinate fasciculus and in the posterior limb of the left internal capsule. The numbers associated with each frame represent standard coordinates in the z axis. The left side of the brain is shown on the left side of each section. FA, fractional anisotropy; MD, mean diffusivity; BD-I, bipolar disorder type I. FA, fractional anisotropy; BD-I, bipolar disorder type I; WM, white matter

