
Fig. 3.
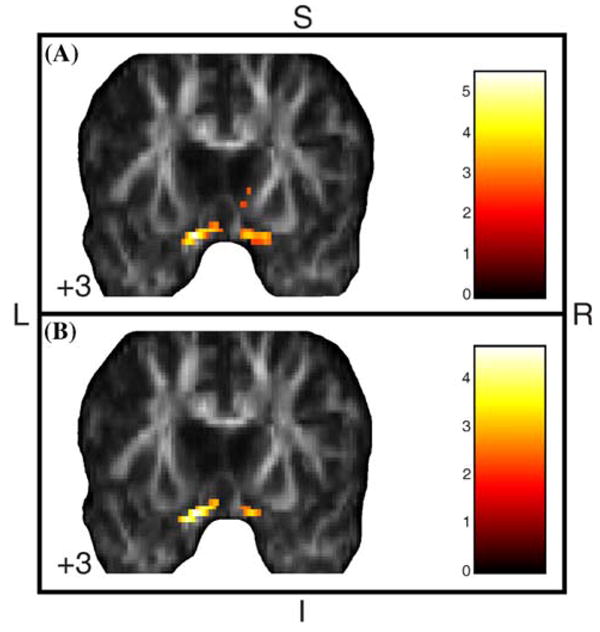
Areas of significantly increased FA in acutely depressed BD-I patients compared to euthymic BD-I (a) and healthy (b) individuals, with age as covariate. Results at the Z > 2.33 threshold were overlaid on coronal brain slices of FA map spatially normalized into an approximation to the Tailarach and Tornoux stereotactic atlas [37]. Foci of significantly increased FA were found bilaterally in the ventromedial prefrontal cortex and adjoining subcortical WM, probably involving the rostral portion of the uncinate and inferior fronto-occipital fasciculi, in depressed BD-I individuals versus both healthy and euthymic BD-I individuals. The numbers associated with each frame represent standard coordinates in the y axis. FA, fractional anisotropy; BD-I, bipolar disorder type I; WM, white matter; S, superior; I, inferior; L, left; R, right