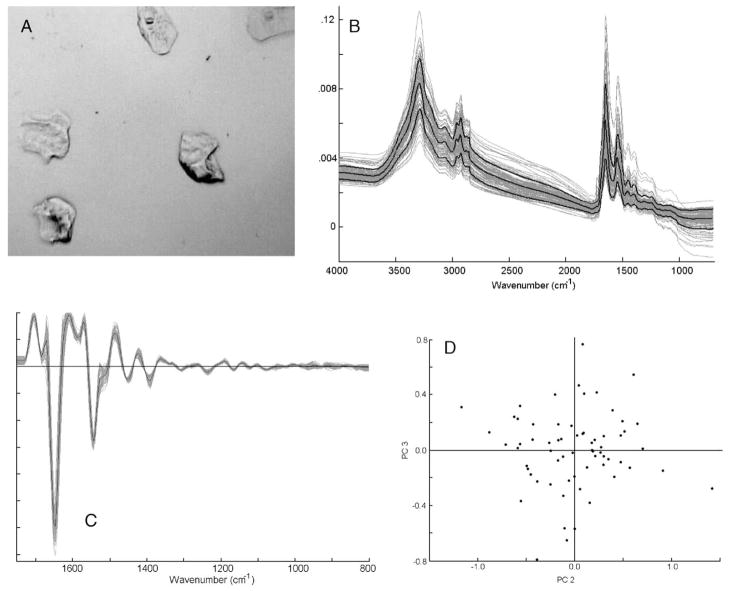
Fig. 1.
Panel A: photomicrograph of a sample of oral mucosa cells, prepared by the CytoSpin method (see text for detail). Panel B: mid-infrared (800–4000 cm−1) spectra of ca. 60 individual oral mucosa cells from one donor. The heavy black lines denote the mean spectrum, and the standard deviation spectra. Panel C: second derivative spectra of data set shown in Panel B, expanded between 800 and 1800 cm−1 Panel D: Scores plot (PC2 vs. PC3) of data set shown in Panel C. Each dot represents one spectrum.

