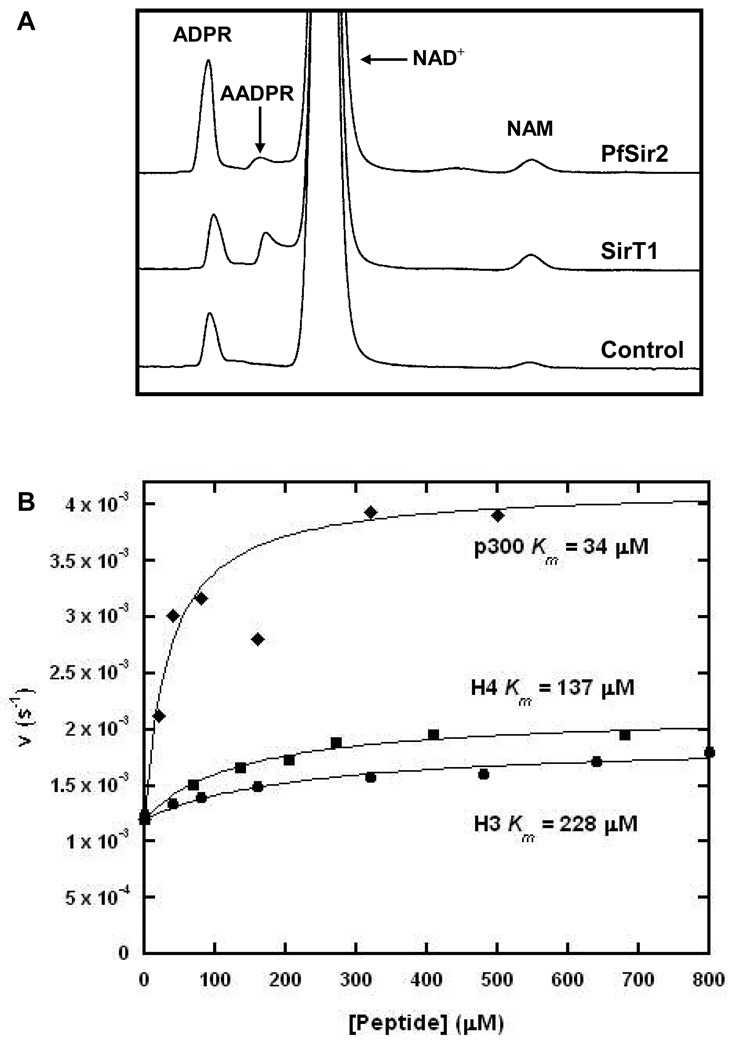
Figure 4. Hydrolysis of NAD+ Catalyzed by Pf-Sir2.
(A) HPLC chromatograms showing the production of ADPR by SirT1 and Pf-Sir2 under similar conditions. (B) the kinetics of the hydrolysis reaction for varying concentrations of peptide carried out in the presence of 400 ∝M NAD+ and 150 mM phosphate buffer, pH 7.3.

