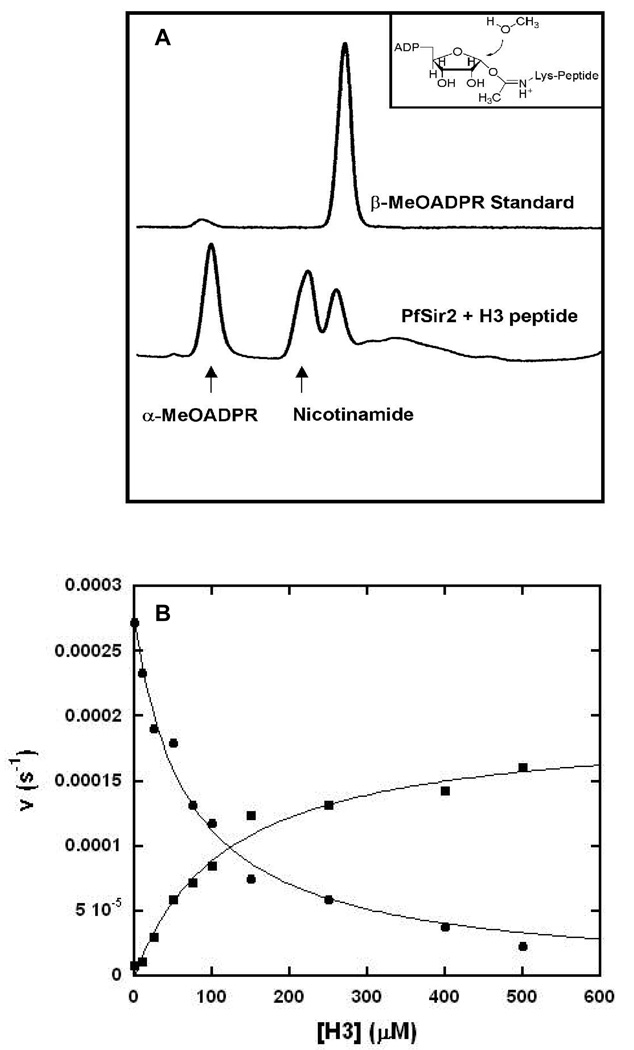
Figure 6. Production of β-face Methanolysis Product.
(A) HPLC chromatograms showing the β-MeOADPR standard, and a Pf-Sir2 reaction run in the presence of H3 peptide and 30% MeOH. (B) Bottom: Pf-Sir2 catalyzed methanolysis with different concentrations of H3 Productions of α-MeOADPR (circle) and β-MeOADPR (square) with different concentrations of H3 are shown. The reactions contained 400 ∝M of NAD+ in 100 mM phosphate buffer with 0, 10, 25, 50, 75, 100, 150, 250, 400 and 500 ∝M of H3 all at pH 8.5. The following Michaelis parameters were determined by fitting the curves with KaleidaGraph: Ki (α-MeO-ADPR) = 70 ∝M, k0 = 2.7 × 10⁻⁴ s−1 Km (β-MeO-ADPR) = 119 ∝M, k500 = 1.6 × 10⁻⁴ s−1 ksolvolysis ([H3] = 0) = 1.38 × 10⁻³ s−1, ksolvolysis ([H3] = 500 ∝M) = 1.40 × 10⁻³ s−1

