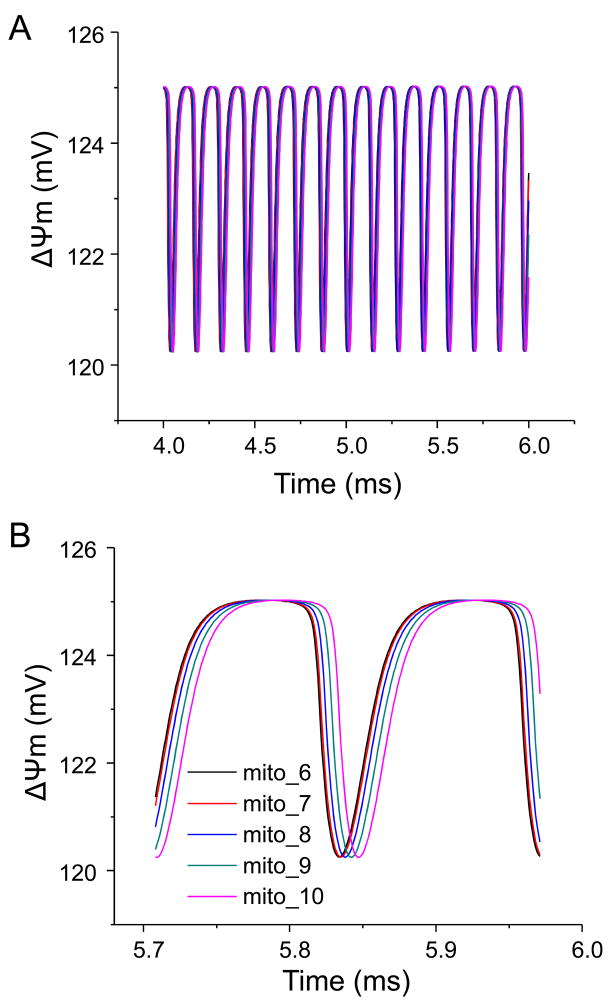
Figure 3.
Simulation of mitochondrial network oscillatory behavior in the physiological domain. Panel A, oscillations of ~5mV amplitude and ~130 ms period were obtained with shunt = 0.1 and EtSOD = 0.8 mM) conditions. Panel B shows a zoom within two oscillatory cycles to highlight the sequential ΔΨm depolarization as well as repolarization. Shown are the results obtained with a linear network of eleven mitochondria. All other parameters were as described in previous publications(Aon et al., 2006b, Cortassa et al., 2006, Cortassa et al., 2004).

