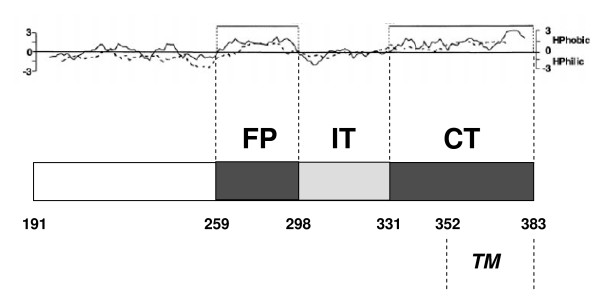
Figure 1.
Schematic diagram of the E1 regions analyzed in this study. The Kyte & Doolittle (continuous line) and Goldman (dashed line) hydrophobicity plots of the E1 protein is shown at the top. The studied E1 fragments are indicated as shaded boxes. The trans-membrane (TM) domain is also shown. Key amino acid positions are indicated.

