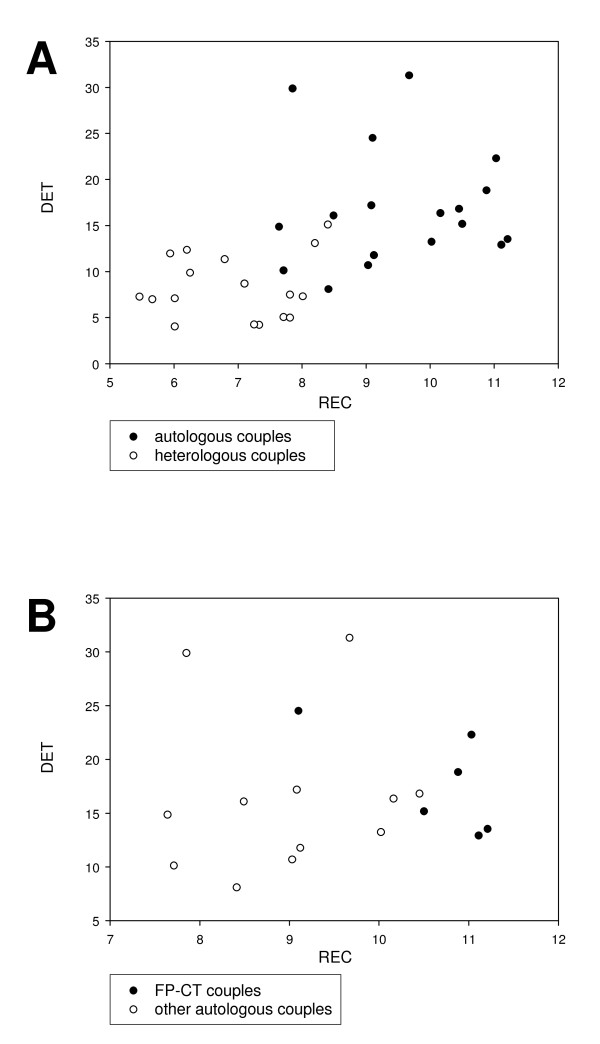
Figure 3.
DET and REC values from (A) autologous and heterologous couples and from (B) FP-CT and other autologous couples. (A) Autologous pairs (FP/IT, FP/CT, IT/CT) (black dots) are more correlated than heterologous ones (FP/Core, CT/Core, IT/Core) (white dots). (B) Differently from other autologous couples (white dots), FP/CT couples (black dots) seem to occupy (with one only exception) the most extreme right portion of the graph, so indicating a possible preferential FP-CT attachment pairs.

