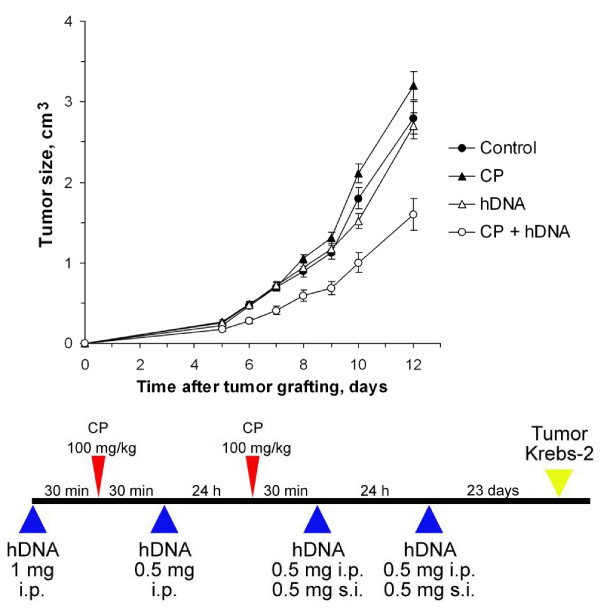
Figure 1.
Tumor growth (mean ± SEM) in mice treated with CP and human DNA, comparing the regimen shown below with the control (n = 10). Mice received two CP injections (100 mg per 1 kg body weight) at a daily interval; 0.5–1 mg human DNA was administered i.p. or s.c. to the mice. The control group was injected with saline. The additional control groups received either CP alone or DNA alone according to the regimen. Krebs-2 tumor cells were grafted i.m. 23 days after the last DNA administration.

