
Figure 3. Imaging of lungs shows reduced microvasculature in GIT1 KO mice.
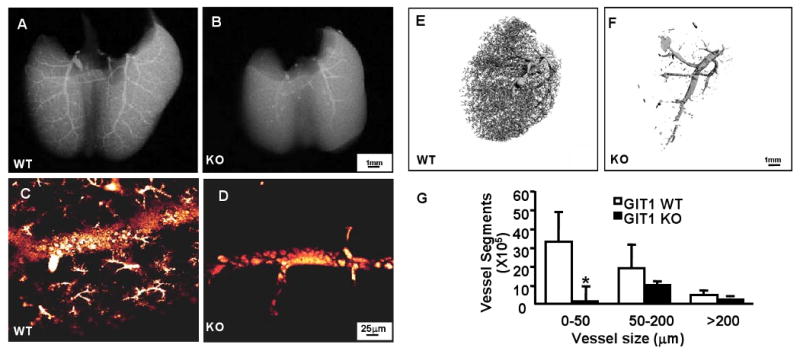
X-ray (A-B), fluorescein microangiography (C-D) micro-CT (E-F) were performed as described in the methods. WT mice displayed numerous small pulmonary arterioles extending into the capillary circulation (A, C, E), whereas there were strikingly fewer arterioles and capillaries in lungs from GIT1 KO mice (B, D, F) G. Quantification of micro-CT data according to the size of the vessels (mean ±SE; n =3,*P<0.05, compared with WT).