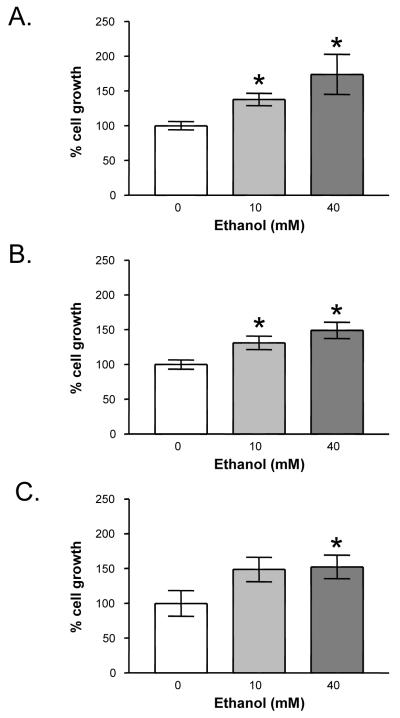
Fig. 2.
Effect of ethanol on HCC cell growth: (A) HepG2, (B) SKHep, and (C) Hep3B. Actively dividing cells were treated for 24 hours with ethanol (0 to 40 mM). Trypan blue excluded cell counts were performed to determine growth relative to untreated, control cells. Each point on the graph represents the mean of triplicate samples +/- SEM. Similar results were obtained in at least three independent experiments. * = P < 0.05 compared to vehicle control.

