Fig 4.
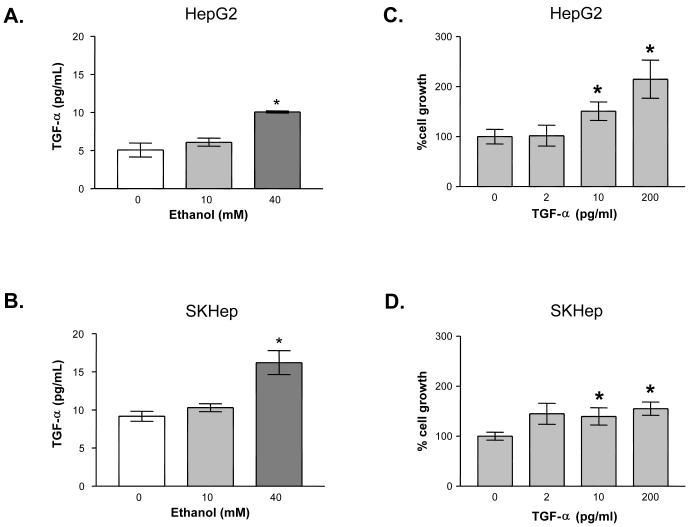
Effect of ethanol on transforming growth factor-alpha (TGF-α) levels in cell culture media: (A) HepG2 and (B) SKHep. Cells were treated for 24 hours with ethanol (0 to 40 mM). A TGF-α ELISA was performed to measure TGF-α (pg/ml) in culture media. Each point on the graph represents the mean of triplicate samples +/- SEM. Similar results were obtained in at least three independent experiments. * = P < 0.01 compared to vehicle control. Effect of exogenous TGF-α on cell proliferation: (C) HepG2 and (D) SKHep. Cells were treated for 24 hours with exogenous TGF-α (0 to 200 pg/ml). Trypan blue excluded cell counts were used to determine growth relative to control untreated cells. Each point on the graph represents the mean of triplicate samples +/- SEM. Similar results were obtained in at least three independent experiments. * = P < 0.05 compared to vehicle control.

