Figure 3.


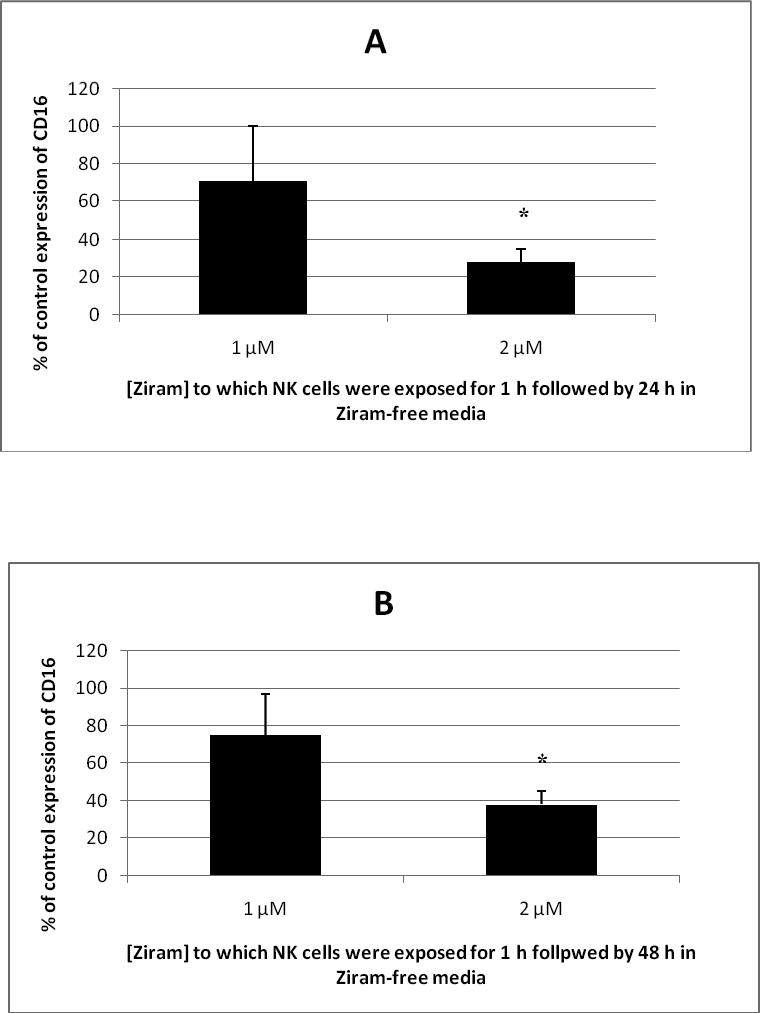
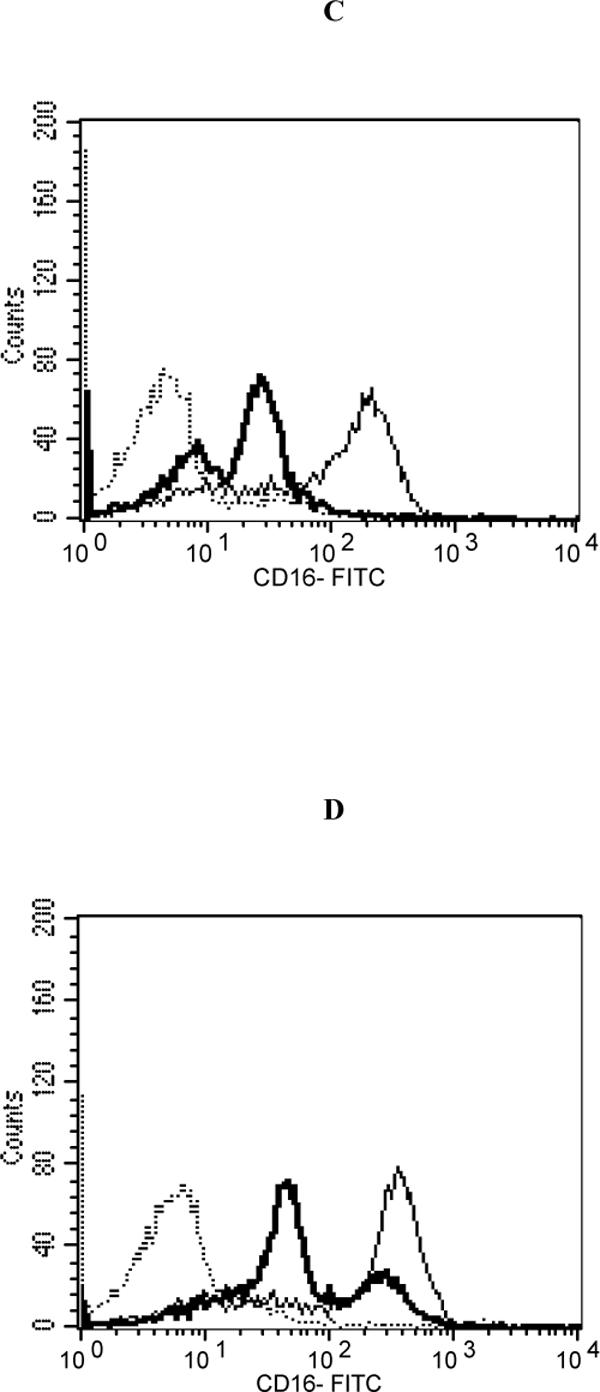
Effects of 1h exposure to ziram followed by 24 h or 48 h in ziram-free media on CD16 expression in NK cells. A.) 1 h exposure to 1 μM or 2 μM ziram followed by 24 h in ziram-free media. Results are mean±S.D. (n=4 for 1 μM; n=5 for 2 μM ). B.) 1 h exposure to 1 μM or 2 μM ziram followed by 48 h in ziram-free media. Results are mean±S.D. (n=4 for 1 μM; n=4 for 2 μM). * indicates that the decrease in CD16 expression was statistically significant (p<0.01). A.) Histogram from a representative experiment of a 1 h exposure to 2 μM ziram followed by 24 h in ziram-free media: Dashed line = IgG (isotype) control; thin solid line = control NK cells stained with anti-CD16 antibody; bold line = ziram-exposed cells stained with anti-CD16 antibody; y axis = cell number; x axis = fluorescence intensity . B.) Histogram from a representative experiment of a 1 h exposure to 2 μM ziram followed by 48 h in ziram-free media: Dashed line = IgG control; thin solid line = control NK cells stained with anti-CD16 antibody; bold line = ziram-exposed cells stained with anti-CD16 antibody; y axis = cell number; x axis = fluorescence intensity .
