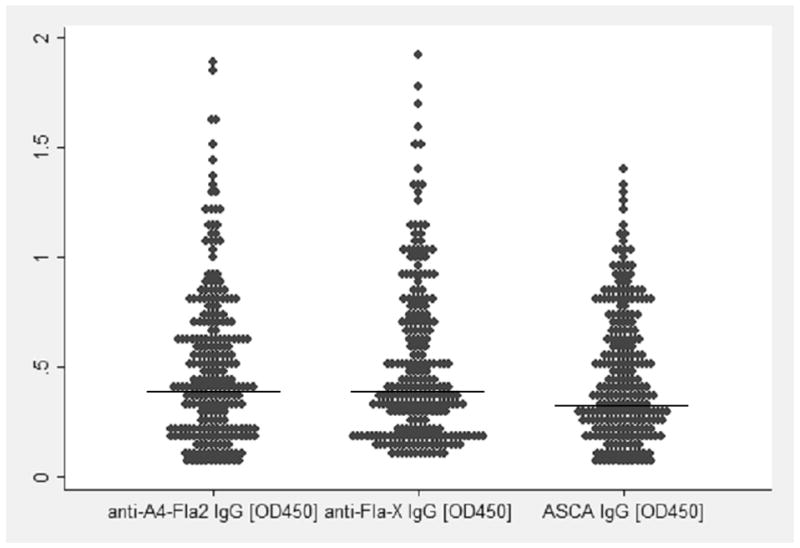
Figure 1.

The comparative scatter plot illustrates the spread of the values (extinctions at OD450) for anti-A4-Fla2 IgG, anti-Fla-X IgG, and ASCA IgG. The horizontal line discriminates the positive values (above the line) from the negatives (below the line).
