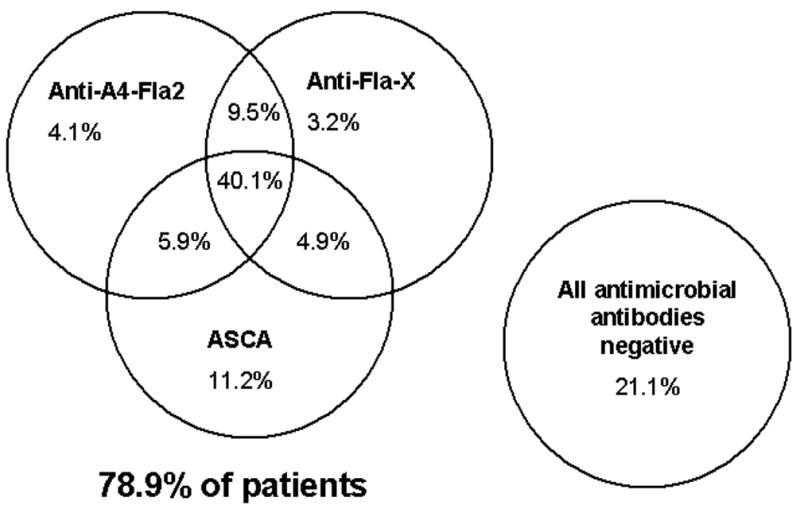
Figure 2.

The Venn diagram shows the relationship between the antimicrobial biomarkers (anti A4-Fla2, anti-Fla-X, ASCA) in the CD cohort (n=252) by presence vs absence. The percentage of patients positive for each marker, any combination of 2 markers, and all markers is shown.
