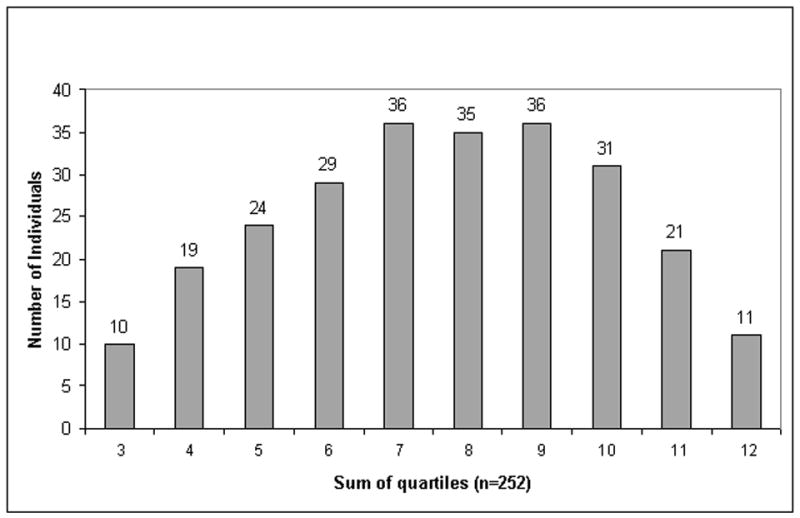
Figure 3.

The distribution of quartile sums is shown. For each of the different markers (anti-A4-Fla2, anti-Fla-X, and ASCA) the population was subdivided into four equal quartiles (each n=63) based on the antibody response (ELISA units). Quartile sums were calculated by adding individual quartile scores for each microbial antigen, ranging from 3 to 12.
